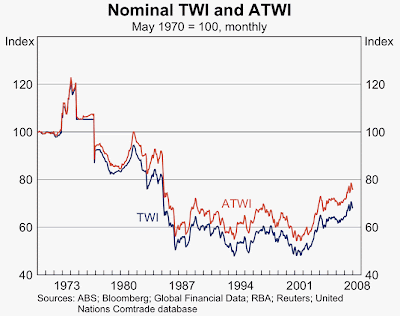
 Bilateral graphs are graphs that compare two sets of data to one another using the same x and y planes. This bilateral graph shows the trade-weighted index of the Australian dollar between the TWI and ATWI weights.
http://images.google.com/imgres?imgurl=http://www.rba.gov.au/publications/bulletin/2008/feb/images/aug-twi-aus-dol-graph4.gif&imgrefurl=http://www.rba.gov.au/publications/bulletin/2008/feb/1.html&usg=___NpUIrFEE4qKGqTg3viUuDyVAGs=&h=526&w=665&sz=41&hl=en&start=15&um=1&itbs=1&tbnid=4dQ05sBtGjkOZM:&tbnh=109&tbnw=138&prev=/images%3Fq%3Dbilateral%2Bgraph%26um%3D1%26hl%3Den%26sa%3DN%26gbv%3D2%26tbs%3Disch:1
No comments:
Post a Comment