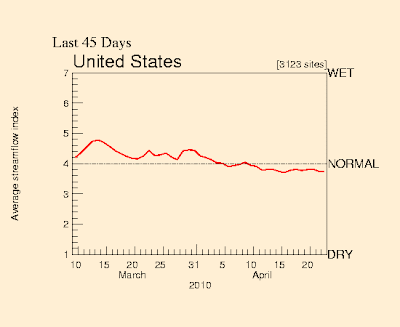
 An index value plot is a graph that plots the data of a variable within a range rather than plotting specific points. This map shows the average streamflow index between March and April 2010. http://images.google.com/imgres?imgurl=http://waterwatch.usgs.gov/regplots/real/real_us_2.gif&imgrefurl=http://waterwatch.usgs.gov/%3Fm%3Dreal%26w%3Dplot&usg=__SkLsaX_xX2VHXAW_RzHpPuLd5-8=&h=450&w=550&sz=7&hl=en&start=12&um=1&itbs=1&tbnid=W4WSMU1TKFatsM:&tbnh=109&tbnw=133&prev=/images%3Fq%3Dindex%2Bvalue%2Bplot%26um%3D1%26hl%3Den%26gbv%3D2%26tbs%3Disch:1
Friday, April 23, 2010
Index Value Plot
 An index value plot is a graph that plots the data of a variable within a range rather than plotting specific points. This map shows the average streamflow index between March and April 2010. http://images.google.com/imgres?imgurl=http://waterwatch.usgs.gov/regplots/real/real_us_2.gif&imgrefurl=http://waterwatch.usgs.gov/%3Fm%3Dreal%26w%3Dplot&usg=__SkLsaX_xX2VHXAW_RzHpPuLd5-8=&h=450&w=550&sz=7&hl=en&start=12&um=1&itbs=1&tbnid=W4WSMU1TKFatsM:&tbnh=109&tbnw=133&prev=/images%3Fq%3Dindex%2Bvalue%2Bplot%26um%3D1%26hl%3Den%26gbv%3D2%26tbs%3Disch:1
Subscribe to:
Post Comments (Atom)
No comments:
Post a Comment