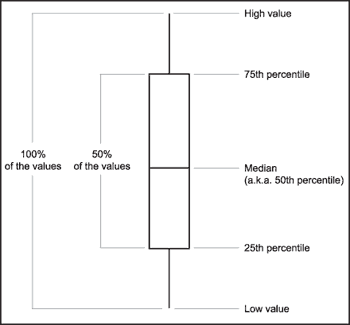
A box plot (or box and whiskers diagram) is a way of representing data through what is known as the 5 number summary. This includes the lowest value, lower quartile Q1, middle Q2, upper quartile Q3, and highest value as shown in this example. This example has no numerical data, but most box plots combine this with numerical data to specify where that data falls into the 5 number summary.
No comments:
Post a Comment