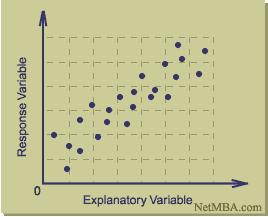
 A scatter plot is used to plot the data of two variables in order to determine a pattern, or lack thereof. This scatter plot doesnt represent any particular variable, but illustrates the kind of result a scatter plot may produce, showing an obvious increasing trend.
http://images.google.com/imgres?imgurl=http://www.netmba.com/images/statistics/plot/scatter/scatterplot.gif&imgrefurl=http://www.netmba.com/statistics/plot/scatter/&usg=__KjtT1wjlB4P5vu-XZGQ5FdqYGlM=&h=217&w=268&sz=4&hl=en&start=2&um=1&itbs=1&tbnid=Mu2181B_9_0hnM:&tbnh=91&tbnw=113&prev=/images%3Fq%3Dscatter%2Bplot%26um%3D1%26hl%3Den%26gbv%3D2%26tbs%3Disch:1
No comments:
Post a Comment