Friday, April 23, 2010

Parallel Coordinate Graph


Parallel coordinate graphs are used to compare large amounts of multivariate data. Each set of data uses the same x and y coordinates. This is a fairly small parallel coordinate graph of the amount of glucose, fructose, maltose, and saccharose in various vegetables and fruits, however, some parallel coordinate graphs can include hundreds of sets of data.

Triangular Plot

A triangular plot uses three variables compared to one another. This map uses three different areas of the Aelutian islands to compare the Hmax off Kaui for various slip allocations.

http://images.google.com/imgres?imgurl=http://www.pmel.noaa.gov/maillists/tmap/ferret_users/fu_2007/jpgCqrZqdDwYG.jpg&imgrefurl=http://www.pmel.noaa.gov/maillists/tmap/ferret_users/fu_2007/msg00384.html&usg=__BbOkUttPv0jmFyojw9chRDfwJaU=&h=464&w=463&sz=135&hl=en&start=2&um=1&itbs=1&tbnid=lX7Ktsi11XtDBM:&tbnh=128&tbnw=128&prev=/images%3Fq%3Dtriangular%2Bplot%26um%3D1%26hl%3Den%26sa%3DN%26gbv%3D2%26ndsp%3D21%26tbs%3Disch:1

Wind Rose

A wind rose is a tool used to determine the distribution of wind speed and direction for a given location. They are always in circular form and depict every direction. This wind rose example does not say what location the data is from, but one can easily assume that wind was coming from the southeast a majority of the month at a wide variety of speeds.

http://images.google.com/imgres?imgurl=http://www.nws.noaa.gov/mdl/pgb/AvnFPS/3.2/html/images/cli-new4.png&imgrefurl=http://www.nws.noaa.gov/mdl/pgb/AvnFPS/3.2/html/climate-new.html&usg=__nnlpXgQqBxWubOR5dhuS04KZHX4=&h=574&w=532&sz=188&hl=en&start=18&um=1&itbs=1&tbnid=FG2VO8Ng48yg-M:&tbnh=134&tbnw=124&prev=/images%3Fq%3Dwind%2Brose%26um%3D1%26hl%3Den%26gbv%3D2%26tbs%3Disch:1

Climograph


Climographs represent the monthly levels of precipitation and temperature of a location. Anyone who has pulled up a long term weather forecast on the internet has probably seen a climograph. This climograph charts out the precipitation and temperature averages for each months for the city of Honolulu, Hawaii.

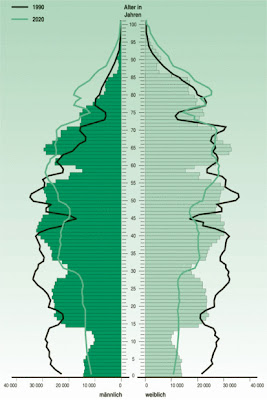
Population Profile

Population Profiles are often portrayed in a pyramid-like form representing population statistics over a given time. This map is of Saxony, and it represents a very backwards trend, with a small infant population and a lare adult population, which could imply lack of reproduction or high infancy death rates. For developed countries, there is usually a much more defined pyramid-like shape to the population profile.

http://images.google.com/imgres?imgurl=http://www.sachsen.de/en/img/413_bevstruktur.jpg&imgrefurl=http://www.sachsen.de/en/225.htm&usg=__mWjhVsmM9xGi_RccqPT34NiI-7I=&h=618&w=413&sz=75&hl=en&start=18&um=1&itbs=1&tbnid=7-38nujySWuz6M:&tbnh=136&tbnw=91&prev=/images%3Fq%3Dpopulation%2Bprofile%26um%3D1%26hl%3Den%26gbv%3D2%26tbs%3Disch:1

Scatter Plot

A scatter plot is used to plot the data of two variables in order to determine a pattern, or lack thereof. This scatter plot doesnt represent any particular variable, but illustrates the kind of result a scatter plot may produce, showing an obvious increasing trend.

http://images.google.com/imgres?imgurl=http://www.netmba.com/images/statistics/plot/scatter/scatterplot.gif&imgrefurl=http://www.netmba.com/statistics/plot/scatter/&usg=__KjtT1wjlB4P5vu-XZGQ5FdqYGlM=&h=217&w=268&sz=4&hl=en&start=2&um=1&itbs=1&tbnid=Mu2181B_9_0hnM:&tbnh=91&tbnw=113&prev=/images%3Fq%3Dscatter%2Bplot%26um%3D1%26hl%3Den%26gbv%3D2%26tbs%3Disch:1

Index Value Plot

An index value plot is a graph that plots the data of a variable within a range rather than plotting specific points. This map shows the average streamflow index between March and April 2010. http://images.google.com/imgres?imgurl=http://waterwatch.usgs.gov/regplots/real/real_us_2.gif&imgrefurl=http://waterwatch.usgs.gov/%3Fm%3Dreal%26w%3Dplot&usg=__SkLsaX_xX2VHXAW_RzHpPuLd5-8=&h=450&w=550&sz=7&hl=en&start=12&um=1&itbs=1&tbnid=W4WSMU1TKFatsM:&tbnh=109&tbnw=133&prev=/images%3Fq%3Dindex%2Bvalue%2Bplot%26um%3D1%26hl%3Den%26gbv%3D2%26tbs%3Disch:1